
This blog post provides a few resources that should help you review some of the difficult population ecology concepts.
Let's start with the basics: Exponential Growth
 |
| (Knowledge Library, Nature.com) |
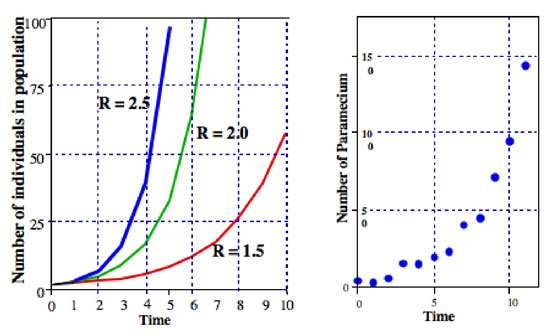
Growth in the size of a population (or other entity) in which the rate of growth increases as the size of the population increases is know as exponential growth. To model this growth we use the below formula, where (N(0)) = initial population size, and (N(t)) = the projected population size (t is an arbitrary time):
N(t)= N(0)R
The figure (above) depicts how rate (R) affects population size, when estimating future growth, given we know what the population size is at t initial.
Geometric Growth Model
Geometric growth model (equation below) expands upon the exponential growth model by including time (t) as a variable. Including time as a variable is important for species that have defined growth periods (e.g., breeding season). For a more detailed description of how this equation is derived, visit this website.
N(t)= N(0)(R^t)
 |
| (Knowledge Library, Nature.com) |
Density Dependence
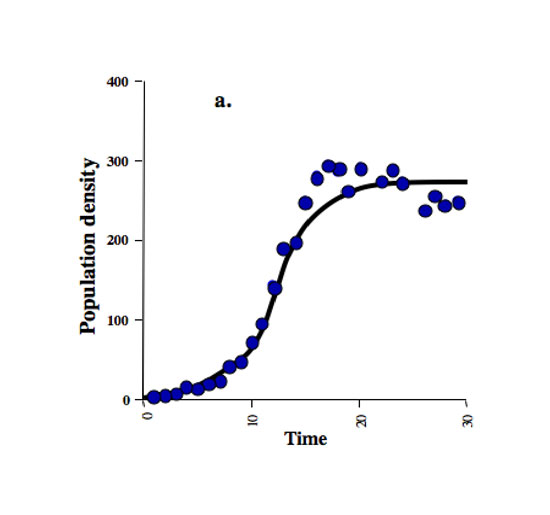
In the natural world, competition and resource availability limit population growth - this is described as carrying capacity (K). That is, an environment or ecosystem is only able to support, or "carry", a maximum population size. As the population size approaches carrying capacity, the growth rate slows. Population growth rate (R) is highest at the inflection point, where R=0.5.
Density dependent factors affecting population size, such as competition or predation are often biotic, whereas density independent limitations are often abiotic, such as environmental stress.
Logistic Population Growth
This equation is density dependent, that is, as the population increases, intraspecific competition increases. The logistic growth model is a common sigmoid curve or "S-shaped" curve, as seen in the carrying capacity graph above.
To find the change in population size over time (dN/dt) while accounting for carrying capacity (K) we use the following equation ("Equation 8"). Where N = population size and r = rate of population change.
Lotka-Volterra competition model

| (Knowledge Library, Nature.com) |
Lotka-Volterra competition model
This model builds on the logistic growth model, by adding a competition coefficient, accounting for a species' ability to inhibit the growth of another (interspecific competition). The equations below are the logistic growth model as discussed above for individual species (species 1, species 2), but a competition coefficient has been added.
Competition coefficients may be denoted as alpha or beta, or as in this example, subscripts on the alpha are different. This coefficient represents the degree to which their competitor may inhibit their growth (alpha) and the size of the competitor's population (N).
| (Townsend et al. 2008. Ecology) |
 |
| (Knowledge Library, Nature.com) |
Survivorship Curves & Life Tables
Through your field reports, you became very family with human life tables and survivorship curves. However, if you need to review, these websites have an overview of life tables and survivorship (figure right).
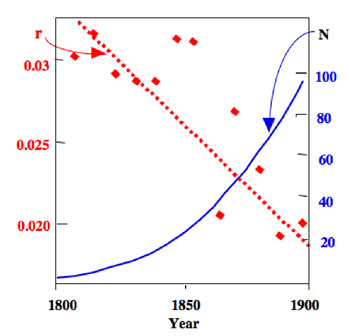
The Allee Effect, or Inverse Density Dependence at Low Density
This effect states that for certain species, when their population is at low densities, there is a positive relationship between population growth rate and density. That is, decreased population growth is correlated with decreasing
abundance, which can result in the population's extinction. This critical threshold (R=1), or Allee threshold, is the tipping point for a population's survival.
The many factors that may lead to the Allee Effect have been loosely categorized as follows:
The most informative description I've found of this phenomenon online (and my source for information) is in this short article by Courcham et al. (1999) published in the scientific journal Trends in Ecology and Evolution (PDF link).
abundance, which can result in the population's extinction. This critical threshold (R=1), or Allee threshold, is the tipping point for a population's survival.
 |
| (Annual Reviews in Entomology, 2008) |
- Genetic Inbreeding - leading to decreased fitness
- Demographic Stochasticity (e.g., sex-ratio fluctuations, or low fecundity)
- Reduced intraspecific cooperation when densities are low
The most informative description I've found of this phenomenon online (and my source for information) is in this short article by Courcham et al. (1999) published in the scientific journal Trends in Ecology and Evolution (PDF link).
No comments:
Post a Comment
Please contact me at Shappell.Ecology -at- gmail.com if you have any questions, comments, or concerns regarding the content of this blog.