Thursday, April 19, 2012

Community Ecology Study Resources

Here are a few resources for additional information regarding topics covered in this section of lecture.


Community Interactions

(Scitable, predator-prey link)


Mighty Mutualisms: Plant-pollinator Interactions

Neat Virtual Lab comparing interspecific competition between Paramecium spp. in a fashion similar to Gause's experiment (note: you may want to record your data table on paper)


Community composition
(Scitable, succession link)


Characterizing communities: richness, evenness, and diversity

Succession: community change through time

Disturbance & Diversity

Community Ecology - a general gateway for exploring related topics.

Biomes of the world - typical climates and common species.


Monday, April 2, 2012

Midterm 2 Study Resources

As you prepare for your upcoming midterm exam, here are some helpful study links (in addition to Sakai resources and my earlier blog postings):
  • Exam taking tips
  • How to read scientific articles & graphs (PDF)
  • Shappell.Ecology website footer help links
  • Quizlet
  • VisionLearning has a free science glossary App for iPhones/iPads (I don't have an iPhone/iPad so if you try this App, please let me know how helpful it is!)
  • Popplet - for the visual and concept-oriented learners, you may want to give this site a try.  Popplet lets you make interactive concept maps using words, diagrams and videos - see basic example below.


  • In addition to the lecture notes, remember to review the assigned articles/activities, section outlines, and glossary terms in your Packet.
The upcoming midterm only includes information from the Ecosystems and Population Ecology sections of lecture.

Quizlet
At this point, nearly all of the terms in Ecosystem and Population Ecology glossaries have been discussed.  Within the Principles of Ecology 2012 study group on Quizlet, I have started two flashcard "sets", one for vocabulary/terms and one for general concepts.

To add flashcard terms to the sets: you must first make a Quizlet profile (this may be done anonymously) and join the study group.

Quizlet has other neat games to help you learn the vocabulary, such as the one below, but it is the responsibilities of you, the student, to build this study resource

A word of Quizlet warning: If you do add terms to the set you are presented with the "auto-define" option - please make sure the definition you choose matches the one in your packet!  Same thing goes for those of you using Quizlet to study, check the definitions against your glossary the first time through.  

While you all are studying in the coming week, I will be grading your reports.  Therefore, I need you all to "self-police/correct" on Quizlet, but feel free to email me if a major problem arises.


Sunday, April 1, 2012

TED Video & Conservation Resources

Here are some interesting resources related to what we have recently learned regarding wildlife conservation.
(Australian Government, Fisheries Mgmt.)

Be mindful of what you eat!
Get the Monterey Bay Aquarium Seafood Watch App available for Android and iPhone users (pictured below).  

Don't have a "smart"phone?  
Print a pocket guide!


Video: Turtle Excluder Device (TED) in action! 

(Video source: National Geographic)

Another neat "smart"phone App: 
Rutgers new iPhone App (beta) includes bus arrival times (Android App due out fall 2012).

Population Growth: A Mini-Review of Key Concepts

This blog post provides a few resources that should help you review some of the difficult population ecology concepts.  Here a few websites to get you started: 

Let's start with the basics: Exponential Growth
(Knowledge Library, Nature.com)

Exponential growth is a type of population growth in which the rate of increase in the number of members is proportional to the number present.


To model exp. growth we use the below formula:

  N(t)= N(0)*(e^(R*t)) 

Where (N(0)): initial population size; (N(t)): the projected population size; R: intrinsic growth rate; and t: an arbitrary time. 
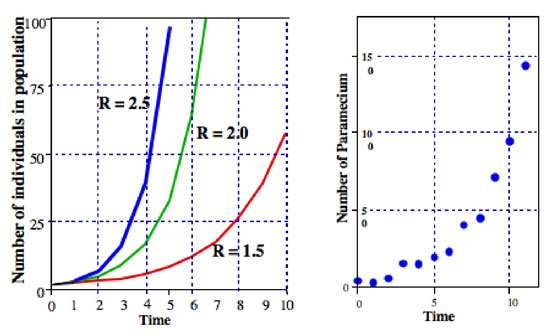
The figure (above right) depicts the extent to which rate (R) affects population size over time (t), given we know the population size at t initial. Note the "J-shaped" growth curve.  (I have not figured out how to use super-/sub-scripts in blogger, sorry!)

Geometric Growth Model

Geometric growth model (equation below) expands upon the exponential growth model by including time (t) as a variable.  Including time as a variable is important for species that have defined growth periods (e.g., breeding season).  

N(t)= N(0)*(R^(t))


When R>1 the population is increasing; R<1 pop. decreasing; R=1 no change in pop. size.

For a more detailed description of how the above equation is derived, and assumptions associated with some of these models visit this website. 
 
Density Dependence

(Knowledge Library, Nature.com)
In the natural world, competition and resource availability limit population growth - this is described as carrying capacity (K).  That is, an environment or ecosystem is only able to support, or "carry", a maximum population size. As the population size approaches carrying capacity, the growth rate slows.  Population growth rate (R) is highest at the inflection point [K/2], after which the growth rate decreases toward zero as N nears K. 

Density dependent factors affecting population size, such as competition or predation are often biotic, whereas density independent limitations are often abiotic, such as environmental stress


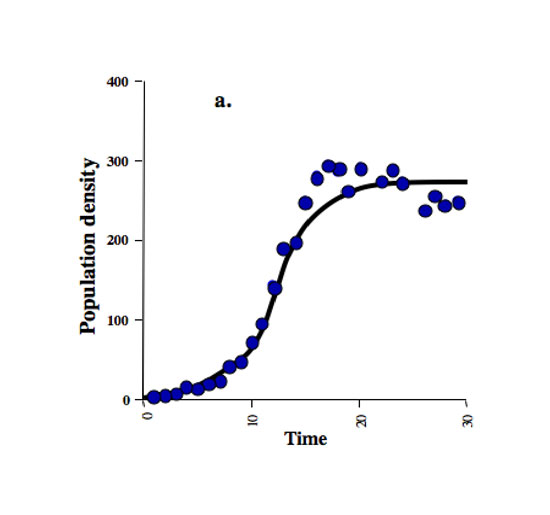
Logistic Population Growth

This equation is density dependent, that is, as the population increases, intraspecific competition increases.  The logistic growth model is a common sigmoid curve or "S-shaped" curve, as seen in the carrying capacity graph above.   

(Knowledge Library, Nature.com)
To find the change in population size over time (dN/dt) while accounting for carrying capacity (K) we use the following equation ("Equation 8").  Where N = population size and r = rate of population change.    


The Allee Effect, or Inverse Density Dependence at Low Density

This effect states that for certain species, when their population is at low densities, there is a positive relationship between population growth rate and density.  That is, decreased population growth is correlated 
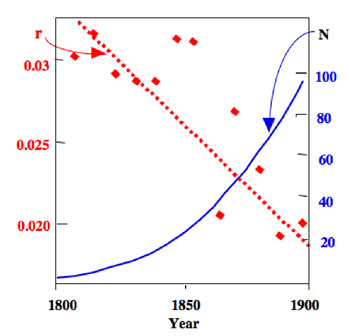
with decreasing abundance, which can result in the population's extinction.  This critical threshold (R=1), or Allee threshold, is the tipping point for a population's survival.
(Ann. Rev. in Ento., 2008)
The many factors that may lead to the Allee Effect have been loosely categorized as follows:
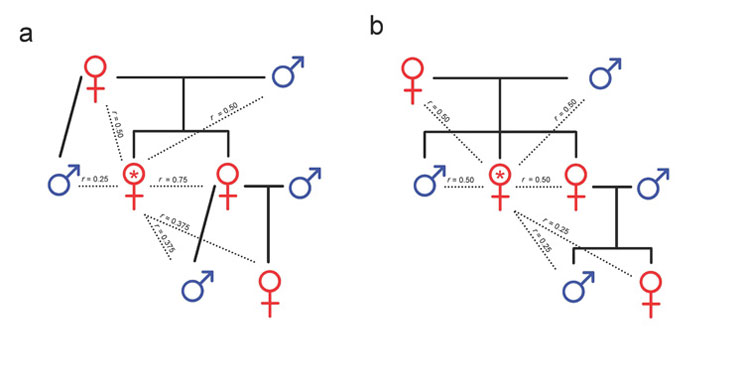
1) Genetic Inbreeding - leading to decreased fitness 
2) Demographic Stochasticity (e.g., sex-ratio fluctuations, or low fecundity)  
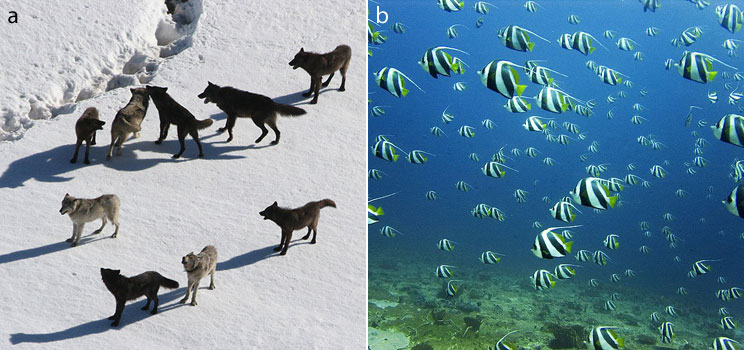
3) Reduced intraspecific cooperation when densities are low
In practice, the Allee effect is of concern to conservation biologist.  Instances such as  managing rare species, monitoring species re-introductions, or preventing the establishment of non-native invasive species all  involve small population sizes.  

The most informative description I have found of this phenomenon online (and my source for information) is in this short article by Courcham et al. (1999) published in the scientific journal Trends in Ecology and Evolution (PDF).  


Lotka-Volterra competition model  
Note: The L-V model is Community Ecology and will be included on the final exam.

This model builds on the logistic growth model, by adding a competition coefficient, accounting for a species' ability to inhibit the growth of another (interspecific competition).  The equations below are the logistic growth model as discussed above for individual species (species 1, species 2), but a competition coefficient has been added. 

Competition coefficients may be denoted as alpha or beta, or as in this example, subscripts on the alpha are different.  This coefficient represents the degree to which their competitor may inhibit their growth (alpha) and the size of the competitor's population (N). 
 
(Townsend et al. 2008. Ecology)


Thursday, March 22, 2012

Survivorship, Life Tables, and Field Report 2

(Knowledge Library, Nature.com)
Survivorship Curves & Life Tables

For your field report, you will become very family with human life tables and survivorship curves.  Here are a few websites to help you along the way:  


A Few Tips for Field Report 2 - DUE in lecture, March 29, 2012
(Oakwood C., Syracuse, NY)
Carefully read the directions (p. 11)
     You will need to collect data on 100 individuals.
         ~25 females (died <1950); ~25 males (died <1950)
          ~25 females (died >1950); ~25 males (died >1950)
         Note: Some cemeteries have specially, designated
           areas where young children are buried.
     Part 1 makes up the majority of the 35 points. 
         Points are about equally spread among the four sub-questions.

Review the field report 2 sample data sheet on Sakai.

Be sure to note the name, city, and state (and country, if applicable) of the cemetery from which you collected data.

Although some of the questions may be posed as "yes" or "no", you are expected to concisely support your answer given the data.  That is, if a question asks about trends in your data, include results (e.g., averages) to support your claims. 

Graphing - Dr. Lockwood showed examples of survivorship graphs in her first lecture.  I strongly prefer that my student make their survivorship graph in Microsoft Excel or other statistical software.  Yes, graphing in Excel may be frustrating, but it is better to familiarize yourself with Excel now, as a student, than later as an employee. 
(Note: I think the Y-axis should be labeled.)

  • Once you are familiar with Excel and making charts, please be sure your chart includes all of the necessary elements (labels).
  • Still having trouble?  This YouTube video shows how to create a survivorship curve. (Note: this link is helpful for the process of creating the graph)
  • Review characteristics of meaningful, efficient, and unambiguous graphic displays (e.g., figure right).
  • Need a statistics refresher? Try these links: Stats Overview & Using descriptive stats (including variance).
  • ...If you still cannot figure out Excel and you want to do your graph by hand, you must use graphing paper.

Field report formatting requirements for Laura's sections:
    1-3 pages, including graphs/tables*
         Reports more than 3 pages will not be read/graded!
         *Laura's students need not submit any data tables.  
               If you wish to include a small summary table (e.g., averages) that is okay.
    Double spaced
    12 pt Times New Roman or Arial font
    1-inch margins
    Print double sided (preferred)
    Stapled
    Document header: student name and section #
    Document footer: page #
    Citations, if needed, do not count toward your page limit. 
        If you do include a bibliography, please follow the Chicago Author-Date Style.  
              A PDF explaining this citation style may be found here.   

Last but not least: 
Use spell check and have someone proofread your field report!   
    Yes, you will lose points for poor writing.

Don't want to make your friends/family suffer through your field report?  
    Take advantage of Rutgers' Writing Center!

The below excerpt is from an article by Dustin Wax, entitled "The Value of Writing Well".
"Writing well is not a gift reserved for the few but a set of skills that can be learned by anyone. The technical aspects can be learned in any of several ways: by taking a class, by studying books on writing, by working with a partner or a group and acting on their feedback. But while grammar and structure are an important part of writing, to write well also demands some effort to develop style. Style is what keeps people reading past the first sentence..." 

Monday, March 19, 2012

Calvin Cycle Clarification

(Wikipedia.com)
Calvin Cycle - Carbon Fixation (Ecosystems Lecture 3)
The Calvin cycle, is the second stage of photosynthesis whereby carbon fixation occurs.  Note: Calling the Calvin cycle the "dark reaction" is a little misleading because it can take place in the daytime, though light is not actively required.
This website gives a quick refresher of the Calvin Cycle, C3, C4, and CAM pathways.

The Ecology of Photosynthetic Pathways provides a more advanced explication of the topic. 


Thursday, March 1, 2012

Need extra help with studying and exam prep?

In addition to attending any of the Principles of Ecology TA office hours for extra help, you may email your TA to set up an appointment.  Also, try reviewing the "Studying & exam taking tips" page on my blog.  Other helpful resources offered at Rutgers:

Rutgers Academic Coaching - My previous students have found these one-on-one study sessions very helpful when preparing for an exam!  You can usually schedule an appointment within 24-48 hours of contacting the office.

Rutgers Writing Centers - Whether you need a proofreader or want to improve your style and grammar, the writing center is a great resource!

Know your learning style? Try taking this Index of Learning Styles Questionnaire by NC State to learn more about how you best learn so that you may maximize your studying time and methods to suit your needs.   

The image, right, is of my learning style quiz results.  As highlighted by the yellow box, I am a very visual learner, hence I show a lot of figures in recitation.

Enjoy tutoring friends?
Did you do well in Physics or Orgo and enjoy peer teaching/tutoring?  Check out the Learning Assistant Program, which pays eligible undergraduates to tutor.

Ecosystems review (updated 4/3, see bold links)

Here are a few resources to help you review some of the Ecosystems concepts covered in this section

Ecosystem Cycling


Energy flow dynamics in different systems
Example (below): General patterns of energy flow for a) forest, b) grassland, c) plankton community at sea, d) community of a stream or small pond.  Relative sizes of boxes and arrows are proportional to the relative magnitude of pools  and flows.  The decomposer system is responsible for much of the secondary production, hence the large/wide respiration arrows indicated in Fig. 11.7.  
.
DOM, dead organic matter; LCS, Live consumer system; NPP, Net Primary Productivity 
(Figure 11.7, Ch. 11, Essentials of Ecology by Townsend et al.)


The below boxplot expands upon Figure 11.7, illustrating the percent of NPP consumed by herbivores in a given system compared to the percent of NPP that becomes DOM.
DOM, dead organic matter; NPP, Net Primary Productivity; Boxplot: 25% CI, median, 75% CI 
(Figure 11.8, Ch. 11, Essentials of Ecology by Townsend et al.)


Water Cycle
 
Hydrologic Cycle - informative cite with interactive practice QUIZ questions!

Here's a diagram of the water cycle that you can use to quiz yourself. You may check your answers here.
 
    Neat water-related links

    Biogeochemical cycles
    General review of some of these cycles: Learner.org.

    Other very useful links - which also have interactive quiz questions:
    Nutrient Budgets, Inputs/Outputs

    .
    Nutrient budget components in terrestrial and aquatic ecosystems.  Inputs = blue, outputs = black. (Fig. 11.12, Ch. 11, Essentials of Ecology by Townsend et al)
    Nitrogen
    Nitrogen cycle schematic (Harrison, 2003)

    Phosphorous
    Phosphorus cycle (Learner.org)
    Check out this narrated and animated video of the P cycle  
    Note, the animation does not go into depth about mineralization/immobilization.

    How does pH affect phosphorous availability?  (figure below)
    Read about it here.


    (MSU Extension)


    Human influences on nutrient cycling
    A comparison of major nutrient pathways (you don't need to know the Sulfur cycle). Maroon arrows = human activities; dashed lines = insignificant pools and fluxes.
    (Fig. 11.16, Ch. 11, Essentials of Ecology by Townsend et al.)

    Tuesday, February 28, 2012

    Interesting/relevant seminars this week

    Some of you may be interested in attending these upcoming seminars...

    Busting the Myths: The Truth about Genetically Engineered Foods 

    Speaker:  Gregory Jaffe of the Center for Science in the Public Interest

    Date/Time:  Wednesday, Feb. 29, 2012 at 4 PM

    Location: Alampi Room, Marine Science Building (IMCS), 71 Dudley Rd

    Hormonal Pleiotropy and the Evolution of Sexual Dimorphism in Body Size

    Speaker: Dr. Henry John-Alder

    Date/Time:  Thursday, March 1, 2012 at 4 PM 

    Location: Alampi Room, Marine Science Building (IMCS), 71 Dudley Rd

    The confounding issues regarding antibiotic resistance - A no win battle!

    Speaker:  Barry Kreiswirth, UMDNJ-New Jersey Medical School

    Date/Time:  Friday, March 2, 2012 at 3:30 PM 

    Location: Alampi Room, Marine Science Building (IMCS), 71 Dudley Rd.

    Thursday, February 16, 2012

    Thermoregulation supplemental resources

    Below is a list of website links that focus on ecological energetic terms and concepts.  Remember to review Dr. John-Alder's lecture supplements posted on SAKAI.  
    (www.nature.com/scitable)

    A more in depth look at allometry & scaling.


    Homeostatic Processes for Thermoregulation - This article is enabled with a click-and-define feature to help you learn vocabulary, while providing a good overview of thermoregulation (figure below).


    (www.nature.com/scitable)

    Body Temperature Regulation 

    • Ecototherm vs. Endotherm
    • Homeothermy vs. Heterothermy 


    Note: Dr. John-Alder did not cover the "Endotherms in the Heat" section of his lecture slides so this material will not be covered on the upcoming exam.

    Sunday, February 12, 2012

    Neat Mimicry Examples

    This past week we talked a bit about mechanisms used by prey to deceive predators.  Here are a couple of neat examples: 

    Batesian Mimicry & Müllerian Mimicry

    I found a website that has interesting photographs comparing Batesian models vs. mimics!  Click the link to find out if the butterfly (left) is a model or a mimic.


    To the right, is an example of Müllerian mimicry, demonstrated by a group of unpalatable butterflies.

    Tuesday, February 7, 2012

    Eusociality learning resources


    How Does Social Behavior Evolve?  
    This is a good overview of altruism, and social behavior as an adaptation that improves fitness.


    Figure 3: Patterns of relatedness in 
    a) diploid and b) haplodiploid species.  
    (Rubenstein & Kealey, 2010)


    Eusociality
    A comprehensive review eusociality  is discussed in Cooperation, Conflict, and the Evolution of Complex Animal Societies by Rubenstein & Kealey (2010).  

    Some of the vocabulary words in the above articles are enabled with a click-and-define feature that should help with reading comprehension.


    Figure 4: Solitary and primitively 
    eusocial wasps. (Nowak et al., 2010).

    An article written by Nowak et al. (2010) entitled The Evolution of Eusociality  explains the role that haploidy and diploidy are hypothesized to play in the inclusive fitness theory.   (Access article through Rutgers)

    Monday, February 6, 2012

    "Gottcha!" The video

    The publishers of this week's assigned reading made this neat short video to accompany the article.

    Testing navigation: a demonstration

    How researchers were able to conclude that some birds may use the stars for navigation?  

    Right, is a diagram of the Emlen, funnel discussed in class.  Ink marks demonstrate the direction in which the bird was trying to fly - note the seasonal difference.  

    To test if birds use stars for navigating at night, these funnels would have been placed in a planetarium, where researchers were able to manipulate the orientation of stars.

    Friday, February 3, 2012

    Quiz time!

    Congrats, to all of you for getting your field reports finished this week!

    Next week in recitation, you have your first recitation quiz.  Content that may be on this quiz was covered in lectures 1, 2 and 3, and this week's recitation, including the assigned packet readings: Viitala et al. & Mayr and Diamond.

    Need help reviewing?
    • Review your notes and the autecology/evolution lecture outlines in the Packet and practice on some of the sample exam questions in the Packet (p. 170).  
    • Peruse some of the links listed in my website footer, such as Evolution 101, the two textbook sites (Essentials of Ecology; Economy of Nature), and the glossary.
    Quizlet
    At this point, nearly all of the terms in the Packet's autecology glossary have been discussed.  I have set up a study group for my sections on Quizlet.   If you join the group, you can add flash card terms and definitions to the "Quiz 1" study set that I started for you all.  The group has other neat games to help you learn the vocabulary, such as the one below, but it is the responsibilities of you, the student, to build the study resource. (This is part of our expectations agreement.)

    A word of Quizlet warning: If you do add terms to the set you are presented with the option of having the website "auto-define" for you - please make sure the definition you choose matches the one in your packet!  Same thing goes for those of you using them to study, check the definitions against your glossary the first time through.  While you all are studying this weekend, I will be grading your reports.  Therefore, I need you all to "self-police" on Quizlet, but feel free to email me if a major problem arises.

    Two packet readings for next recitation: S. Pain. 2008. New Scientist. & Becker and Harris. 2010. PLoS.

    Please keep in mind, many of the scientific articles in the packet may also be accessed through SAKAI, Rutgers Library Electronic Journals, or Google Scholar, so not having your packet is not an acceptable excuse for not reading!