Interested in learning more about this week's neat news feature?
General species information and population research by Pat Magee at WCSU.
Information regarding the species' listing on the federal endangered species list.
And the great YouTube video showed in recitation (video by the Cornell Lab of Ornithology).

Tuesday, March 12, 2013
Monday, March 11, 2013
Population ecology review resources
This blog post provides a few resources that should help you review some of the difficult population ecology concepts. Here a few websites to get you started:
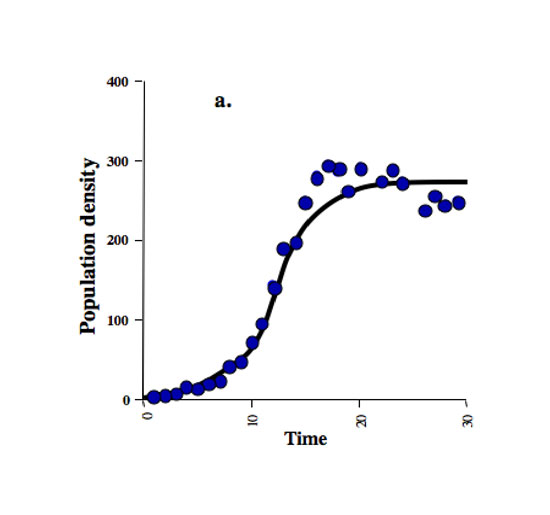
In the natural world, competition and resource availability limit population growth - this is described as carrying capacity (K). That is, an environment or ecosystem is only able to support, or "carry", a maximum population size. As the population size approaches carrying capacity, the growth rate slows. Population growth rate (R) is highest at the inflection point [K/2], after which the growth rate decreases toward zero as N nears K.
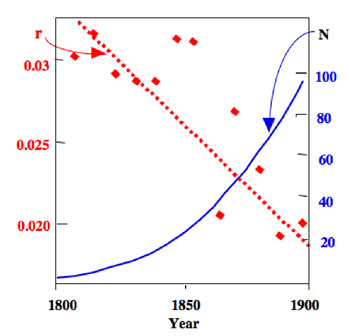
This effect states that for certain species, when their population is at low densities, there is a positive relationship between population growth rate and density. That is, decreased population growth is correlated with decreasing abundance, which can result in the population's extinction. This critical threshold (R=1), or Allee threshold, is the tipping point for a population's survival.
The most informative description I have found of this phenomenon online (and my source for information) is in this short article by Courcham et al. (1999) published in the scientific journal Trends in Ecology and Evolution (PDF).
This model builds on the logistic growth model, by adding a competition coefficient, accounting for a species' ability to inhibit the growth of another (interspecific competition). The equations below are the logistic growth model as discussed above for individual species (species 1, species 2), but a competition coefficient has been added.

Let's start with the basics: Exponential Growth
Exponential growth is a type of population growth in which the rate of increase in the number of members is proportional to the number present.
To model exp. growth we use the below formula:
To model exp. growth we use the below formula:
N(t)= N(0)*(e^(R*t))
Where (N(0)): initial population size; (N(t)): the projected population size; R: intrinsic growth rate; and t: an arbitrary time.
Where (N(0)): initial population size; (N(t)): the projected population size; R: intrinsic growth rate; and t: an arbitrary time.
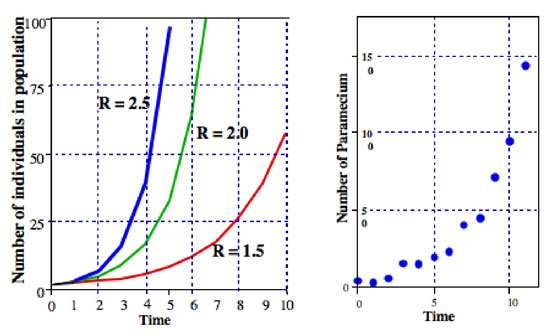
The figure (right) depicts the extent to which rate (R) affects population size over time (t), given we know the population size at t initial. Note the "J-shaped" growth curve. (I have not figured out how to use super-/sub-scripts in blogger, sorry!)
Geometric Growth Model
Geometric growth model (equation below) expands upon the exponential growth model by Including discrete time steps as a variable, which is important for species that have defined growth periods (e.g., breeding season).
N(t)= N(0)*(R^(t))
When R>1 the population is increasing; R<1 pop. decreasing; R=1 no change in pop. size.
 |
| (Knowledge Library, Nature.com) |
Density Dependence
Density dependent factors affecting population size, such as competition or predation are often biotic, whereas density independent limitations are often abiotic, such as environmental stress.
Logistic Population Growth
This equation is density dependent, that is, as the population increases, intraspecific competition increases. The logistic growth model is a common sigmoid curve or "S-shaped" curve, as seen in the carrying capacity graph above.
To find the change in population size over time (dN/dt) while accounting for carrying capacity (K) we use the following equation ("Equation 8"). Where N = population size and r = rate of population change.
| (Knowledge Library, Nature.com) |
The Allee Effect, or Inverse Density Dependence at Low Density
 |
| (Ann. Rev. in Ento., 2008) |
The many factors that may lead to the Allee Effect have been loosely categorized as follows:
1) Genetic Inbreeding - leading to decreased fitness
2) Demographic Stochasticity (e.g., sex-ratio fluctuations, or low fecundity)
3) Reduced intraspecific cooperation when densities are low
In practice, the Allee effect is of concern to conservation biologist. Instances such as managing rare species, monitoring species re-introductions, or preventing the establishment of non-native invasive species all involve small population sizes.
Lotka-Volterra competition model
Note: The L-V model is Community Ecology, but is included here because it builds on the population ecology models we have learned about.
This model builds on the logistic growth model, by adding a competition coefficient, accounting for a species' ability to inhibit the growth of another (interspecific competition). The equations below are the logistic growth model as discussed above for individual species (species 1, species 2), but a competition coefficient has been added.
Competition coefficients may be denoted as alpha or beta, or as in this example, subscripts on the alpha are different. This coefficient represents the degree to which their competitor may inhibit their growth (alpha) and the size of the competitor's population (N).
| (Townsend et al. 2008. Ecology) |
Wednesday, March 6, 2013
Survivorship, Life Tables and Field Report 2
 |
| (Knowledge Library, Nature.com) |
For your field report, you will become very family with human life tables and survivorship curves. Here are a few websites to help you along the way:
- Intro. to Life Tables & Fecundity
- Life tables (Nature.com)
- Survivorship
- General Population Ecology website
A Few Tips for Field Report 2 - DUE in lecture, March 29, 2012
 |
| (Oakwood C., Syracuse, NY) |
Carefully read the directions (p. 11)
You will need to collect data on 100 individuals.
~25 females (died <1950); ~25 males (died <1950)
~25 females (died >1950); ~25 males (died >1950)
Note: Some cemeteries have specially, designated
areas where young children are buried - avoid these areas.
Part 1 makes up the majority of the 35 points.
Points are about equally spread among the four sub-questions.
Review the field report 2 sample data sheet on Sakai.
Be sure to note the name, city, and state of the cemetery from which you collected data.
Although some of the questions may be posed as "yes" or "no", you are expected to concisely support your answer given the data. That is, if a question asks about trends in your data, include results (e.g., averages) to support your claims.
Graphing - Dr. Lockwood showed examples of survivorship graphs in her lecture. I strongly prefer that my student make their survivorship graph in Microsoft Excel or other statistical software. Yes, graphing in Excel may be frustrating, but it is better to familiarize yourself with Excel now, as a student, than later as an employee.
 | ||
| (Note: I think the Y-axis should be labeled.) |
- Once you are familiar with Excel and making charts, please be sure your chart includes all of the necessary elements (labels).
- Still having trouble? This YouTube video shows how to create a survivorship curve. (Note: this video is helpful for the process of creating the graph, your data should not be log-transformed)
- Review characteristics of meaningful, efficient, and unambiguous graphic displays (e.g., figure right).
- Need a statistics refresher? Try these links: Stats Overview & Using descriptive stats (including variance).
- ...If you still cannot figure out Excel and you want to do your graph by hand, you must use graphing paper.
Field report formatting requirements are outlined in the course packet - be sure to follow them!
Last but not least:
Use spell check and have someone proofread your field report!
Yes, you will lose points for poor writing.
Don't want to make your friends/family suffer through your field report?
Take advantage of Rutgers' Writing Center!
The below excerpt is from an article by Dustin Wax, entitled "The Value of Writing Well".
"Writing well is not a gift reserved for the few but a set of skills that can be learned by anyone. The technical aspects can be learned in any of several ways: by taking a class, by studying books on writing, by working with a partner or a group and acting on their feedback. But while grammar and structure are an important part of writing, to write well also demands some effort to develop style. Style is what keeps people reading past the first sentence..."
Subscribe to:
Posts (Atom)