Thursday, March 22, 2012

Survivorship, Life Tables, and Field Report 2

(Knowledge Library, Nature.com)
Survivorship Curves & Life Tables

For your field report, you will become very family with human life tables and survivorship curves.  Here are a few websites to help you along the way:  


A Few Tips for Field Report 2 - DUE in lecture, March 29, 2012
(Oakwood C., Syracuse, NY)
Carefully read the directions (p. 11)
     You will need to collect data on 100 individuals.
         ~25 females (died <1950); ~25 males (died <1950)
          ~25 females (died >1950); ~25 males (died >1950)
         Note: Some cemeteries have specially, designated
           areas where young children are buried.
     Part 1 makes up the majority of the 35 points. 
         Points are about equally spread among the four sub-questions.

Review the field report 2 sample data sheet on Sakai.

Be sure to note the name, city, and state (and country, if applicable) of the cemetery from which you collected data.

Although some of the questions may be posed as "yes" or "no", you are expected to concisely support your answer given the data.  That is, if a question asks about trends in your data, include results (e.g., averages) to support your claims. 

Graphing - Dr. Lockwood showed examples of survivorship graphs in her first lecture.  I strongly prefer that my student make their survivorship graph in Microsoft Excel or other statistical software.  Yes, graphing in Excel may be frustrating, but it is better to familiarize yourself with Excel now, as a student, than later as an employee. 
(Note: I think the Y-axis should be labeled.)

  • Once you are familiar with Excel and making charts, please be sure your chart includes all of the necessary elements (labels).
  • Still having trouble?  This YouTube video shows how to create a survivorship curve. (Note: this link is helpful for the process of creating the graph)
  • Review characteristics of meaningful, efficient, and unambiguous graphic displays (e.g., figure right).
  • Need a statistics refresher? Try these links: Stats Overview & Using descriptive stats (including variance).
  • ...If you still cannot figure out Excel and you want to do your graph by hand, you must use graphing paper.

Field report formatting requirements for Laura's sections:
    1-3 pages, including graphs/tables*
         Reports more than 3 pages will not be read/graded!
         *Laura's students need not submit any data tables.  
               If you wish to include a small summary table (e.g., averages) that is okay.
    Double spaced
    12 pt Times New Roman or Arial font
    1-inch margins
    Print double sided (preferred)
    Stapled
    Document header: student name and section #
    Document footer: page #
    Citations, if needed, do not count toward your page limit. 
        If you do include a bibliography, please follow the Chicago Author-Date Style.  
              A PDF explaining this citation style may be found here.   

Last but not least: 
Use spell check and have someone proofread your field report!   
    Yes, you will lose points for poor writing.

Don't want to make your friends/family suffer through your field report?  
    Take advantage of Rutgers' Writing Center!

The below excerpt is from an article by Dustin Wax, entitled "The Value of Writing Well".
"Writing well is not a gift reserved for the few but a set of skills that can be learned by anyone. The technical aspects can be learned in any of several ways: by taking a class, by studying books on writing, by working with a partner or a group and acting on their feedback. But while grammar and structure are an important part of writing, to write well also demands some effort to develop style. Style is what keeps people reading past the first sentence..." 

Monday, March 19, 2012

Calvin Cycle Clarification

(Wikipedia.com)
Calvin Cycle - Carbon Fixation (Ecosystems Lecture 3)
The Calvin cycle, is the second stage of photosynthesis whereby carbon fixation occurs.  Note: Calling the Calvin cycle the "dark reaction" is a little misleading because it can take place in the daytime, though light is not actively required.
This website gives a quick refresher of the Calvin Cycle, C3, C4, and CAM pathways.

The Ecology of Photosynthetic Pathways provides a more advanced explication of the topic. 


Thursday, March 1, 2012

Need extra help with studying and exam prep?

In addition to attending any of the Principles of Ecology TA office hours for extra help, you may email your TA to set up an appointment.  Also, try reviewing the "Studying & exam taking tips" page on my blog.  Other helpful resources offered at Rutgers:

Rutgers Academic Coaching - My previous students have found these one-on-one study sessions very helpful when preparing for an exam!  You can usually schedule an appointment within 24-48 hours of contacting the office.

Rutgers Writing Centers - Whether you need a proofreader or want to improve your style and grammar, the writing center is a great resource!

Know your learning style? Try taking this Index of Learning Styles Questionnaire by NC State to learn more about how you best learn so that you may maximize your studying time and methods to suit your needs.   

The image, right, is of my learning style quiz results.  As highlighted by the yellow box, I am a very visual learner, hence I show a lot of figures in recitation.

Enjoy tutoring friends?
Did you do well in Physics or Orgo and enjoy peer teaching/tutoring?  Check out the Learning Assistant Program, which pays eligible undergraduates to tutor.

Ecosystems review (updated 4/3, see bold links)

Here are a few resources to help you review some of the Ecosystems concepts covered in this section

Ecosystem Cycling


Energy flow dynamics in different systems
Example (below): General patterns of energy flow for a) forest, b) grassland, c) plankton community at sea, d) community of a stream or small pond.  Relative sizes of boxes and arrows are proportional to the relative magnitude of pools  and flows.  The decomposer system is responsible for much of the secondary production, hence the large/wide respiration arrows indicated in Fig. 11.7.  
.
DOM, dead organic matter; LCS, Live consumer system; NPP, Net Primary Productivity 
(Figure 11.7, Ch. 11, Essentials of Ecology by Townsend et al.)


The below boxplot expands upon Figure 11.7, illustrating the percent of NPP consumed by herbivores in a given system compared to the percent of NPP that becomes DOM.
DOM, dead organic matter; NPP, Net Primary Productivity; Boxplot: 25% CI, median, 75% CI 
(Figure 11.8, Ch. 11, Essentials of Ecology by Townsend et al.)


Water Cycle
 
Hydrologic Cycle - informative cite with interactive practice QUIZ questions!

Here's a diagram of the water cycle that you can use to quiz yourself. You may check your answers here.
 
    Neat water-related links

    Biogeochemical cycles
    General review of some of these cycles: Learner.org.

    Other very useful links - which also have interactive quiz questions:
    Nutrient Budgets, Inputs/Outputs

    .
    Nutrient budget components in terrestrial and aquatic ecosystems.  Inputs = blue, outputs = black. (Fig. 11.12, Ch. 11, Essentials of Ecology by Townsend et al)
    Nitrogen
    Nitrogen cycle schematic (Harrison, 2003)

    Phosphorous
    Phosphorus cycle (Learner.org)
    Check out this narrated and animated video of the P cycle  
    Note, the animation does not go into depth about mineralization/immobilization.

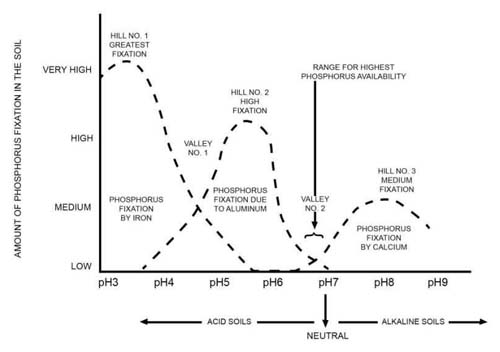
    How does pH affect phosphorous availability?  (figure below)
    Read about it here.


    (MSU Extension)


    Human influences on nutrient cycling
    A comparison of major nutrient pathways (you don't need to know the Sulfur cycle). Maroon arrows = human activities; dashed lines = insignificant pools and fluxes.
    (Fig. 11.16, Ch. 11, Essentials of Ecology by Townsend et al.)