Friday, April 29, 2011

Seafood Watch App now available on iPhone and Android

For the tech savvy sea-life eating of the bunch, Seafood Watch has recently gone digital!  

The app provides up-to-date recommendations on ocean-friendly sea-life (seafood and sushi), compatible with iPhones and Androids.

For those of us without apps at our fingertips, Monterrey Bay aquarium still has their traditional pocket-sized list available as a free download, they even make guides by region.  Here's a link to the northeastern US guide (PDF).

Sunday, April 24, 2011

Ecosystem cycles, pools, and fluxes

Here are a few resources to help you review some of the Ecosystems concepts covered in this section

Ecosystem Cycling


General patterns of energy flow for a) forest, b) grassland, c) plankton, d) stream:
Essentials of Ecology by Townsend et al.


Water Cycle
Here's a diagram of the water cycle that you can use to quiz yourself. You may check your answers here.

Useful links:

Biogeochemical cycles
 For a general review of some of these cycles, click here.
Review of greenhouse gases.  This website has a good description of the nitrogen cycle; links on the left sidebar proved more in-depth description.

Nutrient budget components in terrestrial and aquatic ecosystems; Inputs = blue, outputs = black. (Essentials of Ecology by Townsend et al).
Nitrogen Cycle (Learner.org)
Phosphorus cycle (Learner.org)


A comparison of major nutrient cycles (you don't need to know the Sulfur cycle). Source: Townsend et al.


Saturday, April 23, 2011

A Dose of Diversity - NWF featured article

In 2010, myself, and my research collaboration was featured in a National Wildlife Federation publication.  


To learn more about how diversity may influence vector-borne disease prevalence (and a little about my graduate student research), click on the above link.

NWF 2010 article cover page

Wednesday, April 20, 2011

April is water awareness month!

On World Water Day in March I posted some water conservation facts and a link to calculating your "Water Footprint calculator". After reviewing that post, fill out this electronic form.

Since we started learning about watersheds this week, visit the Environmental Protection Agency (EPA) website "Surf Your Watershed" to learn more about your local watershed.  

The documentary Blue Gold: Water Wars was shown on the College Avenue Campus in April 2011 as part of an initiative to raise awareness about water usage.

EPA has a GoogleEarth file (.kmz) you may download for free.  This data layer has a lot of information, including: watershed boundaries, Federally listed "impaired waters" (degraded or polluted sites), stream flow gauges and sampling locations, and much more!
EPA layer in GoogleEarth (New Brunswick, NJ)

Wednesday, April 13, 2011

Exam studying resources

Hello my studious students!

Here are a few helpful website links for you last minute crammers.  Please note: some of these textbooks use slightly different versions of equations for some of the models we've discussed - don't let it confuse you.


Begon et al. ("BTH" in your packet) - link to a PDF of this ecology textbook's glossary.

Townsend et al. Essentials of Ecology textbook website (similar to BTH book) - interactive multiple choice quizzes and an electronic glossary.

Smith & Smith ("SS" in your packet) Ecology textbook
website - some multiple choice questions for quizzing yourself (not the most interactive website of the bunch).

When I was an undergraduate student at another university my ecology textbook was "The Economy of Nature" by R.F. Ricklefs
, which has a good interactive website including electronic "flash cards" and quizzes.  

Most importantly, don't forget to get a good night's sleep and be sure to eat breakfast in the morning!

Wednesday, April 6, 2011

A few notes about your last (and final!) field report - DUE Monday in Lecture!

    Myself and Dr. Joan Ehrenfeld at one of my research sites in Edison, NJ (2008)
  • Yes, you may collect your second set of data with other ecology students.  You must do your own data analysis and field report discussion.
  • You need to count all of the plant species in your plot, including: moss, grass, herbaceous (forbs), and woody species.  Describe all of the plant species in your plot in an appendix, which goes at the end of the report.  Unknown plant species may be given descriptive nicknames.


  • Your calculations my be included in a table, similar to your field data sheet.
  • When collecting the data, be sure to keep in mind the field report questions.  These questions make up the bulk of your field report.  This is your opportunity to synthesize what you've learned in this class since January, and make connections among the topics we have discussed thus far.  Don't give us "fluff" and "filler", give us substance!
Formatting requirements (Laura's sections): 
1 1/2 spacing;12pt font: Times New Roman or Arial; 1" margins; 1-3 pages in length (excluding graphs or tables); page # in the footer; your name and section in the header.

Tuesday, April 5, 2011

Modeling, Growth Curves, & Survivorship: A Review.

 This blog post provides a few resources that should help you review some of the difficult population ecology concepts.

Let's start with the basics: Exponential Growth
(Knowledge Library, Nature.com)

Growth in the size of a population (or other entity) in which the rate of growth increases as the size of the population increases is know as exponential growth. To model this growth we use the below formula, where (N(0)) = initial population size, and (N(t)) =  the projected population size (t is an arbitrary time): 

  N(t)= N(0)

The figure (above) depicts how rate (R) affects population size, when estimating future growth, given we know what the population size is at t initial.

Geometric Growth Model

Geometric growth model (equation below) expands upon the exponential growth model by including time (t) as a variable.  Including time as a variable is important for species that have defined growth periods (e.g., breeding season).  For a more detailed description of how this equation is derived, visit this website.

N(t)= N(0)(R^t)


(Knowledge Library, Nature.com)
Density Dependence

In the natural world, competition and resource availability limit population growth - this is described as carrying capacity (K).  That is, an environment or ecosystem is only able to support, or "carry", a maximum population size. As the population size approaches carrying capacity, the growth rate slows.  Population growth rate (R) is highest at the inflection point, where R=0.5.

Density dependent factors affecting population size, such as competition or predation are often biotic, whereas density independent limitations are often abiotic, such as environmental stress

Logistic Population Growth

This equation is density dependent, that is, as the population increases, intraspecific competition increases.  The logistic growth model is a common sigmoid curve or "S-shaped" curve, as seen in the carrying capacity graph above.   

(Knowledge Library, Nature.com)
To find the change in population size over time (dN/dt) while accounting for carrying capacity (K) we use the following equation ("Equation 8").  Where N = population size and r = rate of population change.   


Lotka-Volterra competition model
This model builds on the logistic growth model, by adding a competition coefficient, accounting for a species' ability to inhibit the growth of another (interspecific competition).  The equations below are the logistic growth model as discussed above for individual species (species 1, species 2), but a competition coefficient has been added. 

Competition coefficients may be denoted as alpha or beta, or as in this example, subscripts on the alpha are different.  This coefficient represents the degree to which their competitor may inhibit their growth (alpha) and the size of the competitor's population (N). 
 
(Townsend et al. 2008. Ecology)


(Knowledge Library, Nature.com)

 
Survivorship Curves & Life Tables

Through your field reports, you became very family with human life tables and survivorship curves.  However, if you need to review, these websites have an overview of life tables and survivorship (figure right).  


The Allee Effect, or Inverse Density Dependence at Low Density

This effect states that for certain species, when their population is at low densities, there is a positive relationship between population growth rate and density.  That is, decreased population growth is correlated with decreasing
abundance, which can result in the population's extinction.  This critical threshold (R=1), or Allee threshold, is the tipping point for a population's survival.


(Annual Reviews in Entomology, 2008)
The many factors that may lead to the Allee Effect have been loosely categorized as follows:
  1. Genetic Inbreeding - leading to decreased fitness
  2. Demographic Stochasticity (e.g., sex-ratio fluctuations, or low fecundity) 
  3. Reduced intraspecific cooperation when densities are low
In practice, the Allee effect is of concern to conservation biologist.  Instances such as  managing rare species, monitoring species re-introductions, or preventing the establishment of non-native invasive species all  involve small population sizes.  

The most informative description I've found of this phenomenon online (and my source for information) is in this short article by Courcham et al. (1999) published in the scientific journal Trends in Ecology and Evolution (PDF link)

Tuesday, March 29, 2011

Predators, Prey, oh my!

Predators as "keystone" species

This week we've discussed how interactions among tropic levels affect community composition, specifically the role of top predators.  Key examples that we discussed in class include Robert Paine's work in the rocky intertidal zone of the pacific US with predatory seastars, and Jane Lubchenco's work examining how a predator affects algal diversity in New England tide pools (1978).

A great resource by Nature.com entitled "Species with a Large Impact on Community Structure" (2010) includes key terminology with mouse-over definitions to help you learn vocabulary associated with this section.  


Niche Differentiation & Competitive Exclusion
(Knowledge Project, Nature.com)

The figure (right) is an example of a species' fundamental niche, relative to their temperature and food requirements.  Learn more about how the environment affects species distribution here.

The figure (below) demonstrates the concept of competitive exclusion.  Competitively dominant species population (blue) will, in time, exclude the less dominant species (red) in areas where their fundamental niche overlaps.  In this example, the red species would then be confined to its realized niche.  However, if they divide resource - e.g., large seeds for blue, small seeds for red - the two species may coexist; this is termed niche differentiation.  
(Knowledge Project, Nature.com)

Learn more about niche partitioning, competition, and how they affect community diversity.


Wednesday, March 23, 2011

Light pollution and the environment

Lights at night by NASA
This week we've discussed a bit about light pollution, specifically how it affects Loggerhead sea turtles.  An easy to read article by ActionBioscience expands more upon the adverse effects of light pollution on wildlife, from insects to birds.


National Geographic produced the great video, below, of a Loggerhead turtle nest hatching, and their experience in the ocean during their swimming frenzy. 


8:30 pm, Saturday March 26th is Earth Hour.  
Earth Hour began in 2007 in Australia as an effort to raise awareness about climate change. Those who participate, turn their lights off for one hour, starting at 8:30pm. 


Tuesday, March 22, 2011

Happy World Water Day!

Because of increased demands and changes in climate patters, by 2050 a third of the people on Earth may lack clean, potable water.  

"The average American lifestyle is kept afloat by nearly 2,000 gallons of H2O a day—twice the global average."

What's your water use footprint?   
Take this quiz to find out approximately how much water you use every day.  My total score was 1,278 gallons/day, a bit better than the average American, but there is always room for improvement!

Neat water facts from National Geographic - 
how much water does it take to make....

  • Wheat production accounts for 12% of world agricultural water use.
  • 1,799 gallons of water are used to produce 1 lb. of beef
  • 880 gal. water is used to create 1 gal. of cow's milk.
  • 468 gal. of water are used to produce 1 lb. of chicken.
  • It takes nearly 690 gal. of water to make 1 gal. of beer
  • Over 1,000 gal. of water are used to make 1 gal. of wine
  • One cotton t-shirt requires 713 gal. of water.
  • 2.6 gal. of water is used to make one sheet of paper
  • The making of a 0.3 lb hamburger uses over 650 gal. of water. 
  • The supply chain for making one slice of bread requires 11 gal. 

Visit this National Geographic website to learn more about water conservation.

Wednesday, March 2, 2011

Field Report 2 DUE March 21 - Mon. after Spring Break!

Figure from UV Excel Tutorial Website
To ensure you have a fun and stress free spring break, and to make sure you do well on your next field report (most importantly), I would encourage you to get a head start on your report!

This second report (p.12 in your packet) does require some field work, math, and graphing.  

Those of you not familiar with Microsoft Excel, should review this website, which contains helpful tutorials.  They have tutorials for Excel 2003 and 2007 (2010 isn't much different from 2007).

Field report formatting requirements for Laura's sections: 
  • 1-3 pages (more than 3 pages will not be read or graded!)
  • 1 1/2" spacing
  • 12pt Times New Roman or Arial font 
  • 1 inch margins 
  • Print double sided (preferred) 
  • Stapled 
  • Document header: name and section # 
  • Document footer: page #


Monday, February 14, 2011

Pitcher plant seminar this Thursday!

As you all know, you should have read (or will read in the next 10 days) the article in your Packet by Stephanie Pain entitled "Gotcha! flesh-eating pitcher plants are proving to be far more devious hunters than anyone imagined."  

Nephenthes sp. by L. Shappell
It just so happens that this week a botanist from the New York Botanical Garden, Dr. Robert Naczi, will be speaking about pitcher plants!  This seminar, entitled "Systematics of Western Hemisphere Pitcher Plants (Sarraceniaceae): Old Problems and New Data from Symbiotic Arthropods" is open to the public." (Yes, this will help you study for your exam).
 
Date: Thursday, Feb. 17, at 4pm (free snacks and drinks at 3:30pm)
Location: Alampi Seminar room in the Marine and Coastal Sciences (IMCS) building (across from food science building), Cook Campus.

Wednesday, February 9, 2011

News article: fossils, DNA, frogs, & teeth!

The tree frog in question (Wikimedia commons)
A student forwarded me this interesting New York Times article about a frog species that has evolved to have teeth on its lower jaw.  This trait, lost at least 230 million years ago (MYA) in frogs, appears to have reemerged approximately 5-17 MYA in a marsupial tree frog.  

Read The Times article highlighting this research: A Frog Evolved to Regain the Teeth Its Ancestors Jettisoned.


This research was originally published in the peer-reviewed scientific Journal Evolution by John J. Weins (2011).  The full article includes figures with phylogenetic trees illustrating relatedness among species based on genetic DNA results and teeth presence/absence.  

Tuesday, February 8, 2011

Eusociality: the what, how, and why of a controversial topic.


An article written by Nowak et al. (2010) entitled The Evolution of Eusociality explains the role that haploidy and diploidy are hypothesized to play in the inclusive fitness theory.
Figure 4: Solitary and primitively eusocial wasps. (Nowak et al., 2010).


Another comprehensive review of this topic is discussed in Cooperation, Conflict, and the Evolution of Complex Animal Societies by Rubenstein & Kealey (2010).  This article is a bit easier to understand so I would suggest reviewing this one prior to reading Nowak et al.  Additionally, some of the vocabulary words in this article are enabled with a click-and-define feature that should help with reading comprehension.  

The below images are from the Rubenstein & Kealey article.
Figure 1: Group-living is widespread in the animal kingdom.
Figure 3: Patterns of relatedness in haplodiploid and diploid species.


And finally, my former undergraduate assistant was tricked by a mimic.  He got sick after eating an Indian Strawberry (Duchesnea indica) even though I told him not to.  Perhaps the Indian strawberry is a "model" species that the common strawberry (Fragaria virginiana) "mimics"?  
This is an imagine of Indian strawberry. 
Note: the upright growth habit. (Photo by Mike_tn of Flickr)

The edible plants community seems conflicted as to whether Indian strawberry is indeed edible or not, but, when in doubt, don't eat it!

Monday, February 7, 2011

Is it a model or a mimic?

This week we talked a bit about mechanisms used by prey to deceive predators.  Here are a couple of neat examples: 

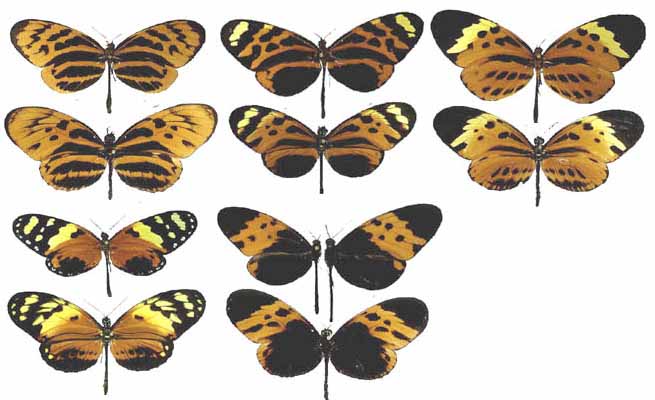
Batesian Mimicry & Müllerian Mimicry

I found a website that has interesting photographs comparing Batesian models vs. mimics!  Click the link to find out if the butterfly (left) is a model or a mimic.


To the right, is an example of Müllerian mimicry, demonstrated by a group of unpalatable butterflies.

Sunday, January 30, 2011

Field report DUE Thursday, in lecture!

Here are a few tips to help you along the way...
Some components of a thorough experimental design:
A research question based on your field observations - Does your question have a practical application?  Is it testable?

A clear hypothesis - A predictive and informed statement, NOT a question.

Independent variables - The manipulated variable or treatment, presumably the "cause".

Control treatment - The non-manipulated treatment that serves as the experiment's baseline.

Dependent variables - Response variable(s) that are measured, presumably the "effect". Do not forget to include units of measurement, such as weight (oz., lb.), time (sec., min.), etc.

Standardized variables - These are other factors or variables that could fluctuate/differ  and affect your results, but are not relevant to your research question. Extraneous conditions not relevant to your hypothesis should be constant throughout all of the treatments; this helps isolate the effects of the independent (manipulated) variable on the dependent variable. 

Replication - What is your level of replication?  How many times will you do the experiment or how many individuals will you include to get a representative sample size?

Methods - Your experimental design should be repeatable to anyone who picks up your field report.  Make sure you clearly identify all of the above terms in your experimental design.  Your design must have all of those components!

Expected results - Because your hypothesis is a predictive statement based on your field observations, you probably have an idea of what the outcomes of the experiment might be.  What do you expect to observe that will allow you to accept or reject your hypothesis?  If you are familiar with statistics and know an appropriate statistical method for your data analysis you may include that, but statistics are not mandatory.

Use those key terms when designing your experiment and writing your report!  Uncertain your organism or question is appropriate?  Feel free to email me before Wednesday (Feb. 1) or ask me before/after recitation.

Field report formatting requirements for Laura's sections:
    1-3 pages (more than 3 pages will not be read or graded!)
    Double spaced
    12pt Times New Roman or Arial font
    1-inch margins
    Print double sided (preferred)
    Stapled


    Document header: student name and section #
    Document footer: page #

Recitation study tip:
Look over the "Autecology - Glossary of Terms" in your packet. Try highlighting or putting a mark next to words that sound familiar.  Revisit this glossary in a week and see if you can highlight any more words.  This brief study method should help you prepare for your recitation QUIZ in two weeks (Feb. 6 or 7).  By the time you have your quiz, all of the words in your packet will be highlighted/checked!